
In which I test several color meters (an Asensetek Lighting Passport, two Sekonics, and a Minolta) side-by-side; compare the spectral quality of various lights; and may have figured out one reason why color meters often overestimate required tint corrections. (Updated 10 March 2015 with more info on the C-700.)
I bought the Lighting Passport for some product development work I’m doing, along with the well-used (and well out of calibration) Minolta Color Meter II. The two Sekonics I borrowed from Art Adams: his own, recently-calibrated C-500, and a C-700 prototype on loan from Sekonic.
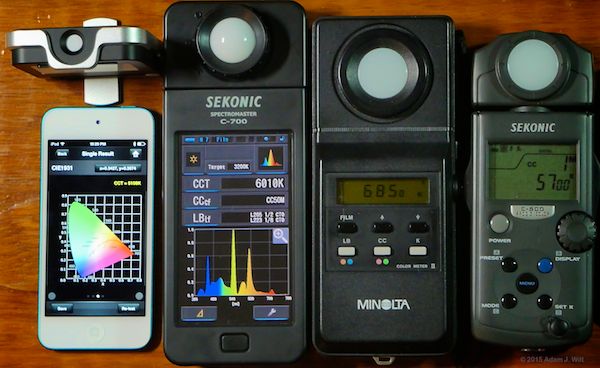
Four color meters: Lighting Passport, Sekonic C-700, Minolta Color Meter II, Sekonic C-500
The Minolta Color Meter II and the Sekonic C-500 are “traditional” color meters; they use separate R, G, and B sensors to measure the relative intensities of those three colors, and they compute a “correlated color temperature” (CCT; see below) from those readings. They also report the green/magenta balance of the light, a.k.a. the “tint”.
“Tint” is the chromatic variable in the image above: the fluorescent desk lamp to the right of the meters is almost a full “plus green” or Wratten CC30G greener than the fluorescent floor lamp to the left. Look at the shadings across the metering dome on the C-700, or the highlights on the rings around the sensor windows on both the C-500 and C-700. Heck, the whole right side of the picture is greener than the left side.
The Minolta is old-school: it has three sensors attuned to the typical spectral sensitivities of the three layers in color film.
The C-500 is a dual-mode, film/digital meter with two different red cells, one attuned to film’s red layer, and the other to a typical digital camera’s red response (and according to Sekonic’s 2008 brochure [PDF], “In Digital mode, the color temperature and compensation readings are based on human visual response”). These graphics (from the Sekonic brochure) illustrate the difference:
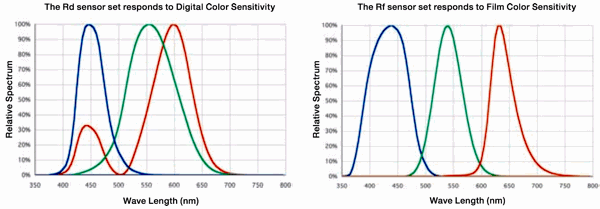
Visual/digital and film sensitivity curves, from Sekonic’s brochure.
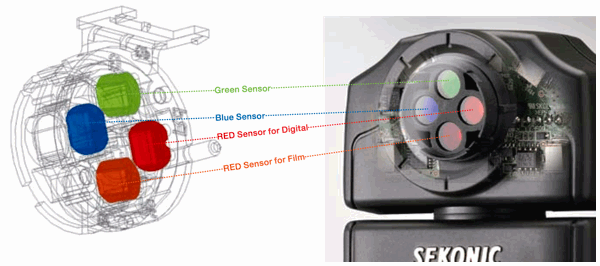
The sensor head in the C-500, from Sekonic’s brochure
The other two meters, the Asensetek Lighting Passport and the brand-new, not-quite-shipping-yet C-700 [PDF], are spectrometers: they break incoming light down into its constituent wavelengths (the Lighting Passport using a diffraction grating; the C-700 using a linear variable filter) and measure the resulting relative intensities using a line-scan sensor array, essentially a one-dimensional camera. (The effect is the same as passing white light through a prism to decompose it into colors, just as we’ve all seen on the cover art for Pink Floyd’s The Dark Side of the Moon.) Once you’ve broken down the light into its individual wavelengths, you can compute whatever spectral sensitivity function you want, to match film, digital sensors, or the human visual response.
The C-700 is designed for film and video, and it offers both film and digital readings, as well as full spectral plots, filter compensations, CIE diagrams, and CRI readings and histograms.
The Lighting Passport is designed for the LED lighting industry and isn’t aimed at film and video specifically; it tries to emulate the human visual response, which should be pretty close to the digital-camera response if we are to believe Sekonic. The Passport measures CCT, CRI, CQS, and half a dozen other parameters; it generates CIE diagrams, spectral plots, CRI histograms and spider plots, and all sort of things like MacAdam ellipsis diagrams and C78.337-2008 [PDF] charts (all incredibly useful if you’re trying to shoehorn your new architectural LED lighting product into a standardized color-temperature and quality rating; not so much if you just want to pick a color-correction filter pack).
What the heck is CCT?
The CCT is the color temperature of a light (its blueness or amberness), as measured in kelvins (K), that best correlates to the color of a “blackbody radiator”: essentially, a lump of stuff heated to that particular temperature, so that it glows with that same color. If the light you’re measuring is a hot lump of stuff – say, a length of tungsten wire in a halogen atmosphere, headed to incandescence with electric power – then the correlated color temperature is the color temperature of that glowing lump. If the light is created by some other means – LED, plasma, or fluorescent lighting, for example – the light may not have the smooth, continuous spectrum of a blackbody radiator, and that’s where the “correlated” bit comes in: the color temperature reported by your meter will correlate to the approximate appearance of a blackbody radiator at that temperature even if the mechanism for producing the light differs, along with the actual spectral content:
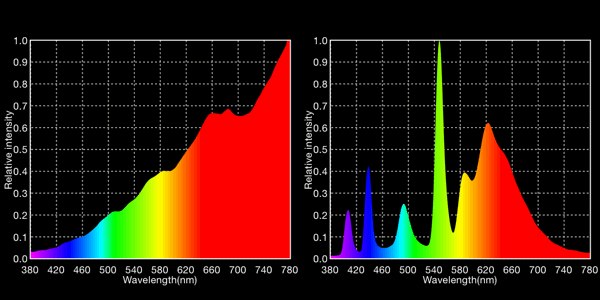
2720K CCT tungsten lamp vs. 2959K CCT Kino Flo fluorescent lamp, as measured with Lighting Passport. Both look pretty much the same to the naked eye… well, more or less…
And therein lies a problem: what constitutes a “correlated” match? This opens the big can o’ worms called metamerism, “the matching of apparent color of objects with different spectral power distributions.” Film-oriented color meters, like the Minolta, the C-500 in film mode, and the C-700 in film mode, try to “look at” color the same way color film does; meters set up for digital imaging (in my test, the C-500 and C-700 in digital mode) try to match the color sensitivities of digital cameras. But that doesn’t necessarily mean that their readings will agree!
The tests
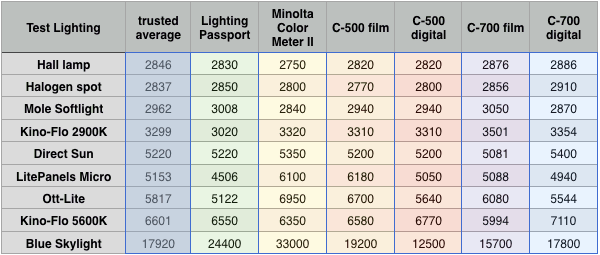
Test 1: various sources, color temperatures only
“Hall lamp”, “Halogen spot”, and “Mole Softlight” are all old-school tungsten lamps.
The Kino Flos (Diva-lite 400s) are film/video fluorescents, using several-year-old tubes. And yes, it’s Kino Flo, not “Kino-Flo”, and the “5600K” nominal tubes are really 5500K nominal. I should really do my proofreading before I generate my charts and graphs.
The Ott-Lite is a “full spectrum” or “natural light” household fluorescent.
The Litepanels Micro is a first-generation camera-top LED light (yes, it’s Litepanels, not “LitePanels” as I label it in the graphics. Sorry ‘bout that).
“Direct Sun” and “Blue Skylight” were measured outside around 1pm on a sunny day in late December in Mountain View, California – Direct Sun with the meter aimed right at the sun, Blue Skylight aimed 90º away at the open sky, with the meter shaded from direct sunlight.
“Trusted average” is the average of the color temperatures measured by the Lighting Passport and the two Sekonics in both film and digital modes (an arbitrary decision on my part after looking at the data).
Note that while I show single numbers in the chart, those are typical readings. When I took repeated readings, even after controlling for things like warm-up time (all lamps had at least 20 minutes of warm-up before measurement) and voltage fluctuations, I would often get variance, on the same meter, of +/- 60 around 3000K and +/- 150 around 5400K.
I also found that I got different readings on different days, probably due to ambient temperature differences and differences in line voltage. Thus you’ll see different readings for the same light on the same meter in different tests.
Here’s what I got: The Lighting Spaghetti Monster!
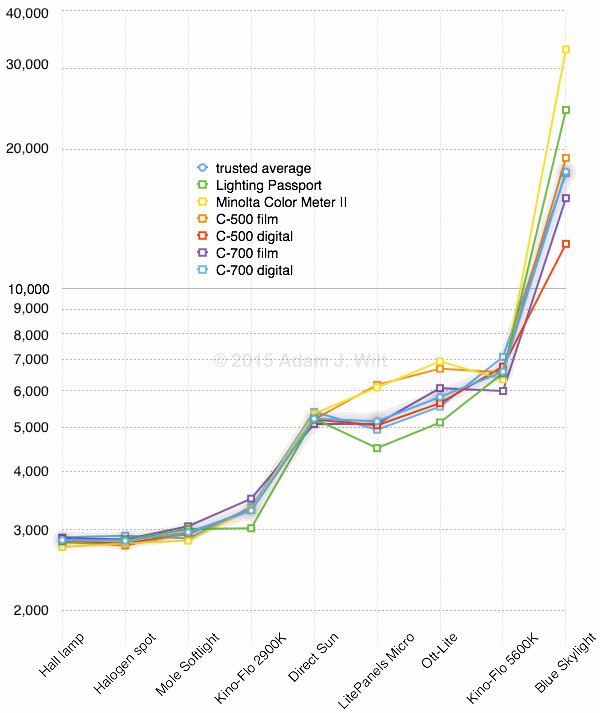
Test 1: all readings, log scale, K vs lighting type
I used lines to connect the points for each meter across the various tests. If all the meters track the color temperatures in the same way, even if their calibrations differ, the lines on the chart should run roughly in parallel. They do not.
Here’s a more detailed look at two of the temperature ranges:
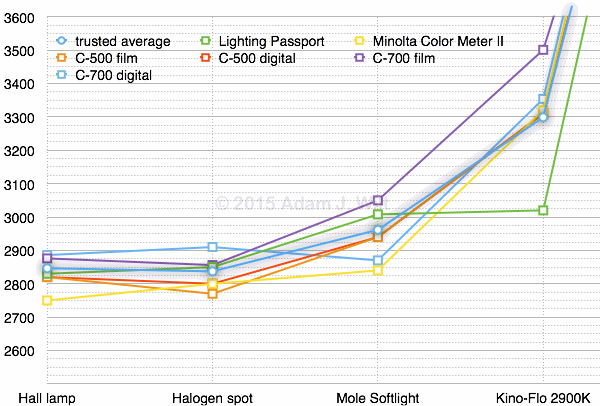
“Tungsten” lights around 3000K, K vs lighting type
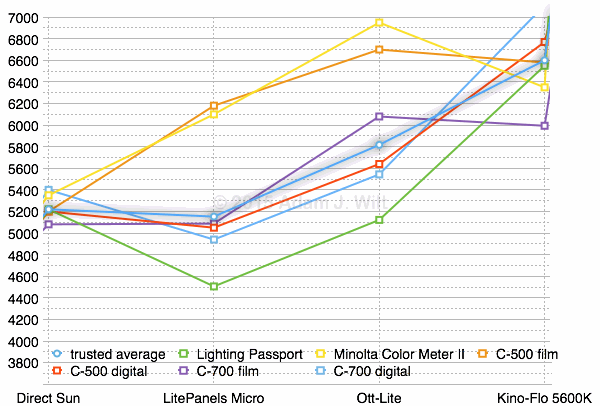
“Daylight” lights around 5400K, K vs lighting type
- Meters agree reasonably closely on blackbody-like sources: the incandescent lamps and direct sunlight. On sources with discontinuous, lumpy spectra (see below) or the extreme CCT of the open sky, there’s much more variation in the CCT reported.
- Compared to the average, the Lighting Passport reports a much lower CCT on the Litepanels Micro, the Ott-Lite, and the Kino Flo with 2900K tubes.
- The C-500’s film mode and the Minolta read quite a bit higher than the average on the Litepanels Micro and the Ott-Lite.
- The C-700’s film and digital modes are very far apart on the Kino Flo’s 5500K tubes.
- Open sky readings are all over the map, from 12,500K to 33,000K.
- As the crossing and recrossing plot lines show, different meters react differently to various lights: they don’t just differ by a scale factor, they have fundamentally different spectral sensitivities.
Here are the results from another test, this time with both temperature and tint values plotted. I’m using bar graphs to show comparable levels for each setup, without regard to how the meters track from one setup to another:
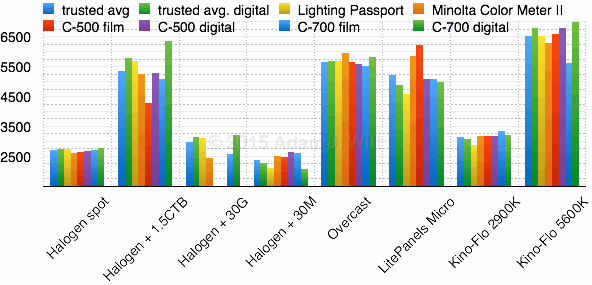
Test 3: CCT, K vs lighting type
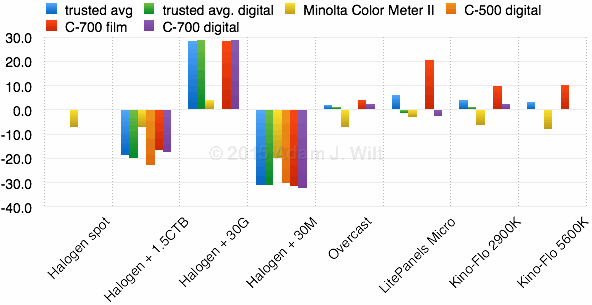
Test 3: normalized tint, CC# (+G, -M) vs lighting type
The first four tests were done with a home-made test cell (black construction paper with a diffusing window: the repurposed tracing overlay from a defunct Wacom tablet) and, in the latter three cases, correction gels:
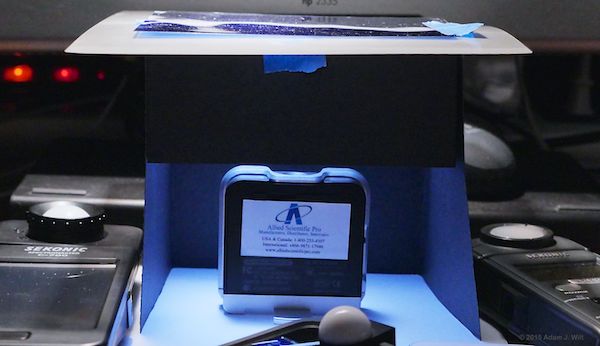
Lighting Passport reading halogen lamp through 1.5CTB filter
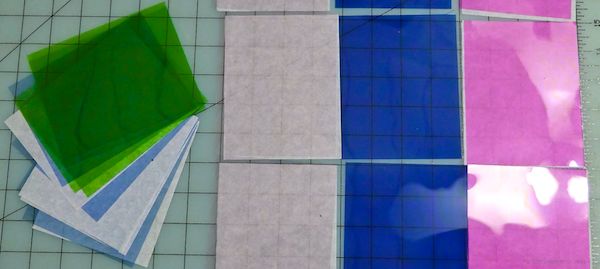
Plus Green, 1/4CTB, 1/8 Minus Green, full CTB, and Minus Green gels
It was a cloudy day when I ran this set of tests, so “Overcast” replaced the Direct Sun and Blue Sky tests.
The C-500 refused to read in the halogen + CC30G test, claiming underexposure; the Lighting Passport software didn’t report tint directly, though a measure of it (Du’v’) is buried in the data file (I’m using the “cheap” Lighting Passport Essence; if I’d shelled out the extra $600 for the Standard model, Du’v’ would be displayed directly). Thus there are no tint readings for the Passport, and no readings for the C-500 in the 30M test. Also, in film mode the C-500’s tint reading is on a different screen and I didn’t record it for all tests, so I’ve excluded it from the charts.
“Trusted average” is again the average of the Sekonics and the Lighting Passport. “Trusted average digital” averages the Sekonics’ digital-mode readings and the Lighting Passport, ignoring the film-oriented readings.
The tint readouts differ for all the meters, so I’ve normalized them all to show about +30 on the “halogen + 30G” test to make ’em visually comparable. Except that I missed normalizing the Minolta. Sorry.
Additional findings from this new test?
- Again, the blackbody-like sources gave largely consistent readings; lumpy-spectra sources did not.
- Adding extreme gels to a tungsten light, like 1.5CTB, reduces the predictability of what the meters will show.
- That poor Minolta really needs a trip to L.A. for recalibration.
“A man with one watch knows what time it is. A man with two watches is never sure.” If I might extend this a bit, “a man with one color meter knows what a light’s color temperature is. A man with four color temperature meters hasn’t got a freakin’ clue, and will likely suffer an anxiety attack.”
OK, it’s not that bad. Color meters, like exposure meters, aren’t used as absolute references in our industry, but as scouting tools (“We’re gonna need gels. Lots of gels.”) and as color matching meters. In the first case, they tell you whether the light is overly amber or blue, green or magenta; the exact number isn’t as important as the general magnitude of the difference. In the latter case, if you’re trying to match a light on location – say, correct a camera-top light to match a bank of overhead flouros, or gel a window to match your key – it’s more a matter of finding out how one light differs from another, so you can pick your gels based on something other than eyeballing the colors.
And if you’re trying to hit a specific target (for example, one of the three preset color temperatures a Sony camera in CineEI mode allows), the color meter will still get you 90% of the way, and help you correct for tint errors.
Absolute accuracy isn’t expected, especially with lumpy-spectra lights, as Kino Flo points out [PDF]:
Unfortunately the color meters available to cinematographers are far from being scientifically accurate. They act as a great comparative tool to determine differences between two given light sources but are inadequate in providing definitive data. You will rarely find two color meters, even if they are the same models, which provide equal data. Results between meters may be similar but not identical. … Minolta disclaims its meters’ Color Compensating (CC) data when reading fluorescent lamps and recommends film tests to determine correct filtration.
Even (especially) in the see-it-now digital world, that last point holds true: a color meter can get you in the ballpark, but the final arbiter of correctness is what your production camera sees, not what the meter sees. The more lumpy your source’s spectrum is, the more a slight difference in the spectral responses of your camera and meter will be likely to cause visible mismatches between what the meter predicts and what the camera sees.
Next: Full vs lumpy spectrum plots; Lighting Passport and C-700 spectra compared.