
I don’t recommend exposing to the right with any other camera (excluding projects where each shot is a stand alone beauty shot) but it works very well with this one. Adam and I found that a great compromise is to expose log in the center of the histogram, and indeed most of our test footage was shot that way.
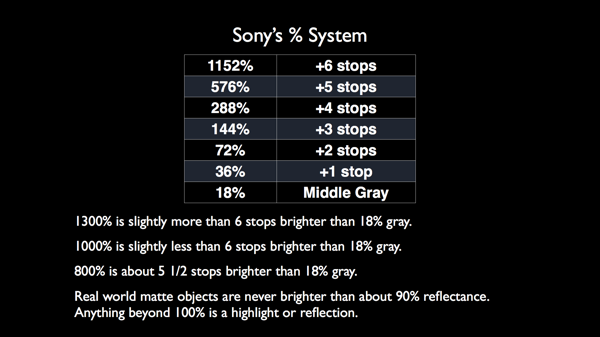
Sony tells you how much dynamic range a gamma curve can contain by giving it a percentage designation. All percentages are based on 18% gray, and you can quickly figure out how much overexposure headroom you’ll get out of a Sony gamma curve by doubling 18% gray until you come close to what the curve designation is. Every doubling of 18% gray equates to an exposure increase of one stop, so five stops of overexposure headroom looks like this:
- 18% x 2 = 36% (+1 stop from 18%)
- 36% x 2 = 72% (+2 stops from 18%)
- 72% x 2 = 144% (+3 stops from 18%)
- 144% x2 = 288% (+4 stops from 18%)
- 288% x2 = 576% (+5 stops from 18%)
A 576% curve can hold detail in highlights that are 5 stops brighter than 18% (middle) gray. In the real world matte objects are never more than 90% reflectance unless they are being struck by more light, so most overexposure headroom goes to holding detail in sunlit backgrounds or specular highlights.
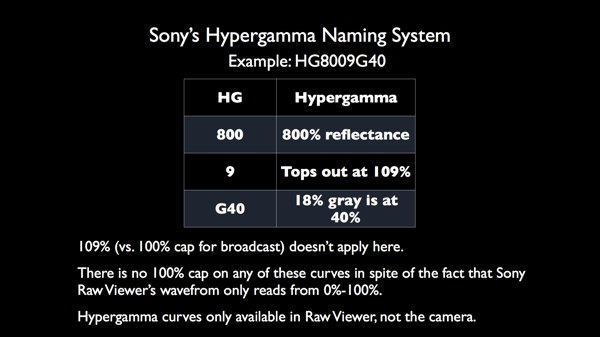
Sony’s Hypergamma curve designation is pretty easy to understand once you see it broken down, as you do in the graphic above. They work the same way in the Sony F5 and F55.
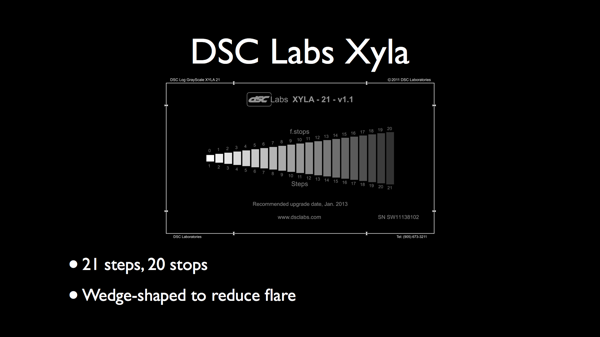
A while back I mentioned the DSC Labs Xyla chart. This chart has 21 steps that are exactly one stop in brightness apart from each other.
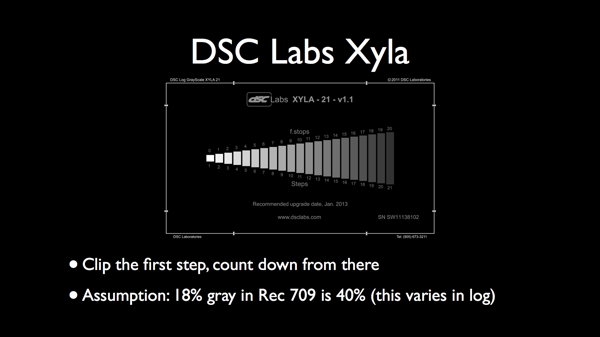
The one reference we have with any digital camera is the clipping point, or where it completely gives up due to extreme overexposure. By clipping the first step we have an objective reference by which we can judge any camera’s dynamic range.
Middle gray is always 40% (technically 41.7%) on a waveform monitor in Rec 709 gamma. In log gamma this point varies as log is not meant to be viewed directly and is really just a storage format. Because of that manufacturers can designate a different waveform value for middle gray as a colorist will simply move that point into the proper position later on during the grade. (Most log curves place middle gray lower than normal, around 30-32%, as this provides an additional 1/2 to 1 stop of overexposure headroom. As clipped highlights have always been the bane of digital cameras this additional highlight latitude makes a big difference.)
Here’s the Rec 709 overlaid on a 4K raw image. When I start counting at the top chip, which is clipped, I see three steps, or stops, until I hit 40%, or middle gray. Three stops of overexposure headroom isn’t much, but that’s just the nature of the Rec 709 stock gamma curve. It’s an archaic gamma curve that every camera manufacturer has to include, but I’d recommend never using it. (I see seven or eight more steps between middle gray and the noise floor, which means about eight stops of shadow detail before hitting noisy black.)
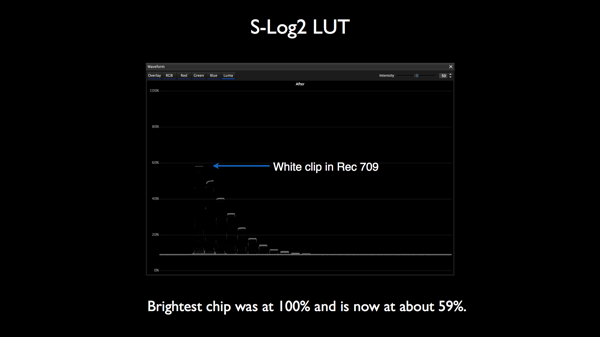
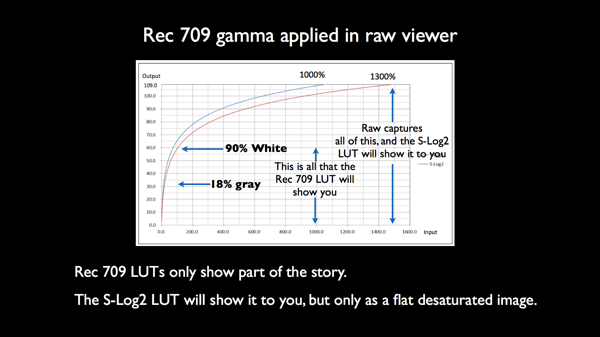
The previous chart was exposed so that the top chip clipped at 100%. Without changing anything else, the chart above shows what happens when I applied the S-Log2 LUT in Sony raw viewer. You can see that the Rec 709 LUT was extremely deceptive as it chopped several stops of dynamic range off what the camera can actually capture.
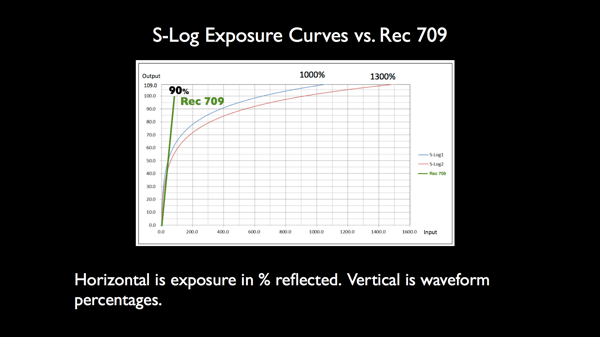
This graph shows the difference between Rec 709, S-Log1 and S-Log2. The horizontal axis is the brightness of something in the real world, while the vertical axis shows how it gets translated into a signal that you’d see on a waveform monitor. The legacy Rec 709 gamma curve manages to fill it’s entire storage range for brightness with a very narrow range of real world brightness levels.
S-Log1 and S-Log2 do much, much better because they don’t have to follow the same rules. For example, in Rec 709 100% on a waveform is white, but in S-Log1 and S-Log2 that value falls around 60%, with lots more room for highlight information. This will look strange on a Rec 709 monitor, but the idea is that you grade this image before anyone sees it that way.
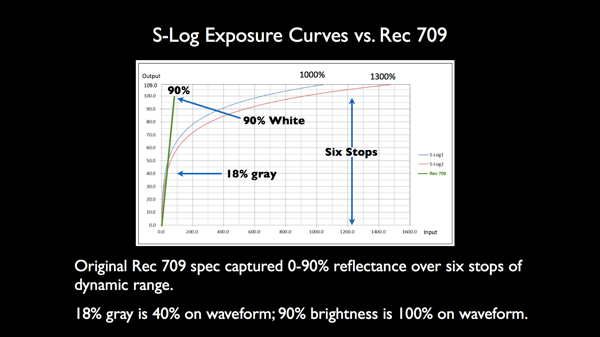
The original Rec 709 spec was only designed to capture about six stops of dynamic range, as that’s what cameras could capture 15-20 years ago when the spec was originally devised.
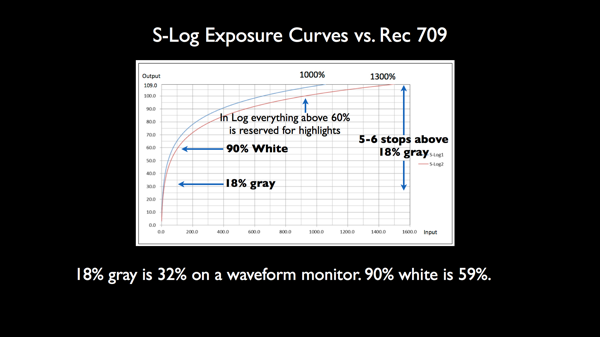
Sony log curves store middle gray at 32%, opening up more room for highlight information. 90% white, which is the brightest matte white you’ll typically see in the real world, falls at around 59% in S-Log. Everything else, up to 109%, is dedicated to highlight detail. (You don’t want to put important detail too far up that curve, as the more it flattens out the less contrast there is between brightness steps: highlights become compressed.)
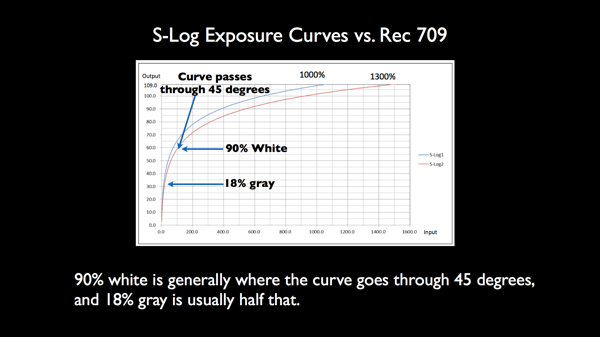
Sometimes manufacturers give you these charts but don’t tell you exactly where important values fall. I’ve discovered that 90% is always at the point where the curve passes through a 45-degree angle, and middle gray is halfway between that point and 0%.
It’s not a good idea to shoot with this camera using the Rec 709 LUT: it’s chopping off a couple of stops of dynamic range and artificially clipping parts of the image that are actually preserved in raw. I prefer to view the image in log and toward the middle of the histogram: I may drive the colorist crazy by making them grade every shot individually but I know that I’ve captured absolutely as much information as I possibly can.
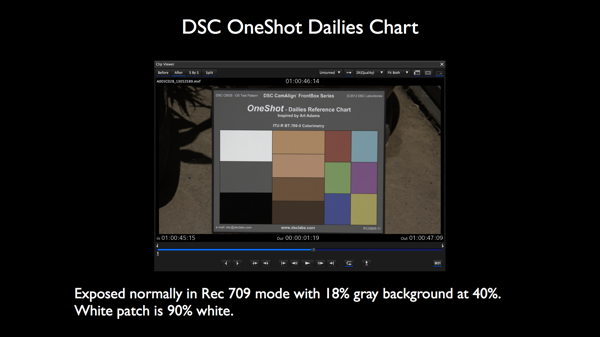
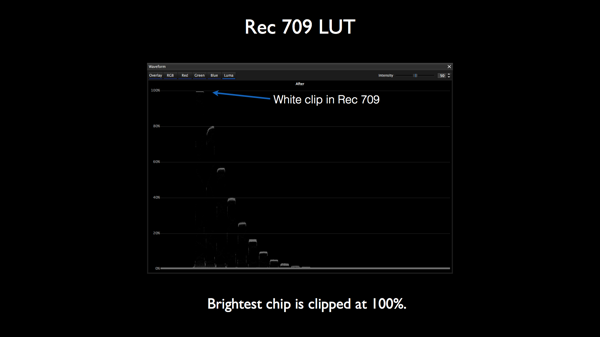
Just for fun I decided to show how a common grading chart looks in each mode of operation. This was captured in raw but with the Rec 709 LUT applied. That white patch is about 90% reflectance, and in Rec 709 it looks very bright indeed.
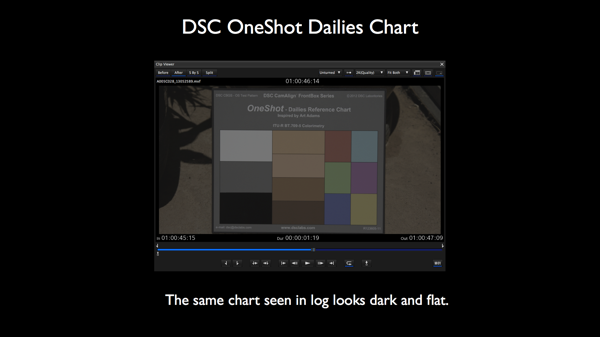
Keep in mind that the Rec 709 spec was only designed to capture about six stops of dynamic range, and in log mode we’re cramming about 13 stops into it. This results in 50% less contrast, which is why the image looks flat. Note how the white chip is no longer bright white, as raw can capture several stops more highlight detail than Rec 709 can.
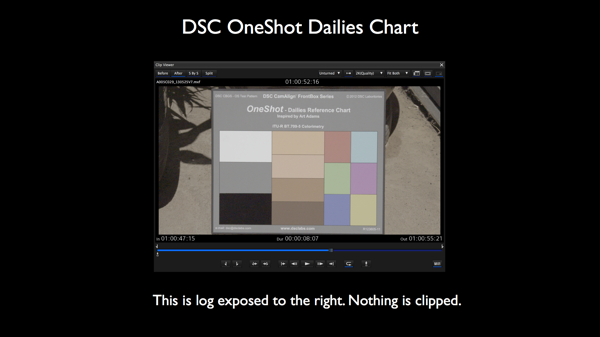
This is the same chart exposed such that white is now almost clipping when viewed in log mode. (That’s LOG, not Rec 709.)
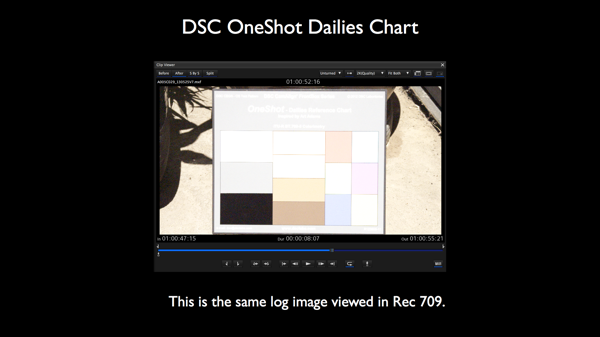
When the shot above, exposed so that white clipped in LOG mode, is viewed through the Rec 709 LUT we can see just how limited the Rec 709 gamma curve is.
Next: SLog2 LUT, Rec 709 LUT, Conclusion…