
Breakfast foods grow odder and odder:
It’s a wise child that knows its own fodder.— Ogden Nash, “Snap, Crackle, Pop”
As with foods, so with lights: between LEDs, HMIs, plasmas, and fluorescents, it’s hard to know exactly what you’re getting from your lighting these days. Color temperature meters help, but if you really want the ugly truth, you need a spectrometer. Only a spectrometer will show you the makeup of your light: whether it’s smoothly distributed across the visible spectrum, yielding naturalistic and predictable color rendering; or concentrated into sharp spikes with large gaps between ‘em, which often leads to disappointing color performance.
Until recently, spectrometers suitable for measuring photographic lighting were too expensive for widespread use: instruments like the Photo Research SpectraScan PR-655 Rich Pierceall used in a 2012 LED lighting test typically run in the $10,000 to $15,000 range.
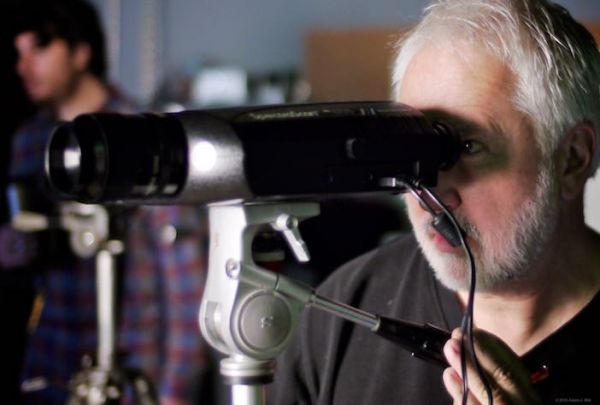
Rich Pierceall uses a SpectraScan 655 to explore light
In 2013, Ikan brought the UPRtek MK350 to the USA; it initially sold for around $2000 if I recall correctly, but went as low as $1450 before being replaced with the $1500 CV600. Last year, Sekonic introduced the cine-oriented $1500 C-700 SpectroMaster.
But in between, and largely off the radar of film & video types, Taiwan’s Asensetek started shipping the Lighting Passport, a spectrometer using a Bluetooth-connected iOS or Android device as its control surface and processing engine. The Lighting Passport is available in two basic versions: the $1295 Lighting Passport Essence and the $1995 Lighting Passport Standard; there’s also the $2495 Flagship Set, a Standard bundled with an iPod touch and an enclosing frame.
There are also PRO versions that add flicker, humidity & temperature sensors for around $300 more. Early-2016 prices in US dollars are from Canada’s Allied Scientific Pro, but these prices fluctuate constantly; check the website for the latest versions. Les Kacev in San Diego also carries Lighting Passports, but he doesn’t show pricing info.
These are the only two distributors in North America and they don’t target film & video folks, which is one reason you probably haven’t seen these things on-set much.
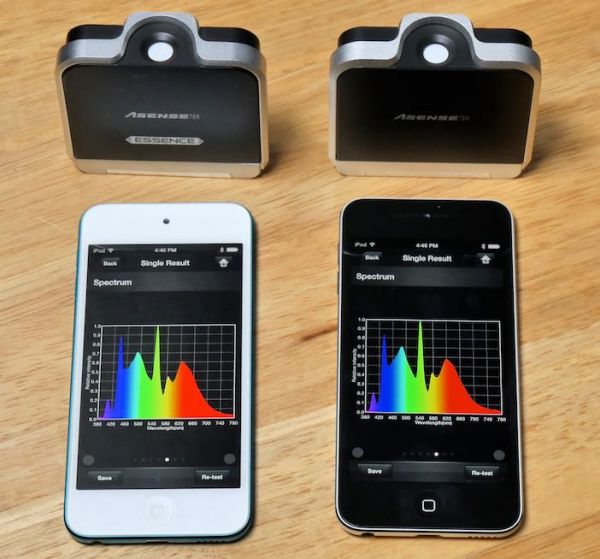
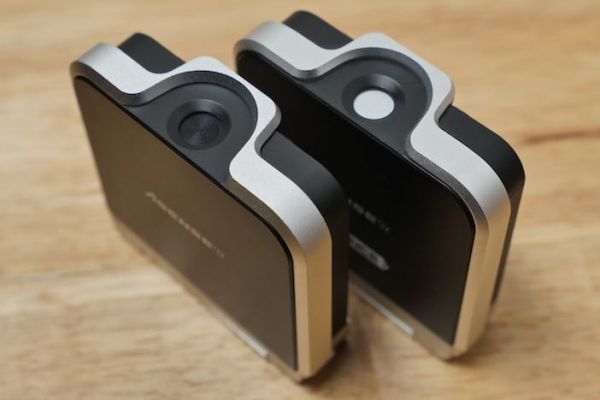
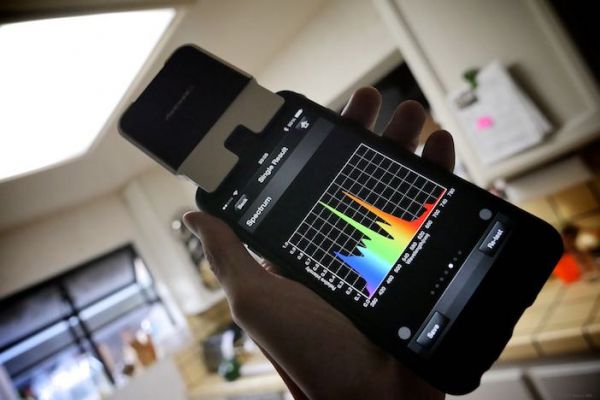
Lighting Passport Essence and Standard models being controlled by iPod touch 5Gs
While none of these are exactly cheap, they’re also not made of platinum-plated unaffordium. I bought an Essence in 2014 when it was then on sale for $1295 (normally $1500 back then), and I’ve seen it as low as $995 since; these are prices within the range of serious film & video lighting geeks.
I got the Essence primarily to aid in developing color metering for Cine Meter II, in the process of which I tested and compared a variety of color meters. Asensetek noticed that writeup and got in touch with me to discuss color measurements for film & video; we exchanged emails back and forth for a month; and at NAB 2015 they gave me a Lighting Passport Standard to compare and contrast with the Essence.
Hardware
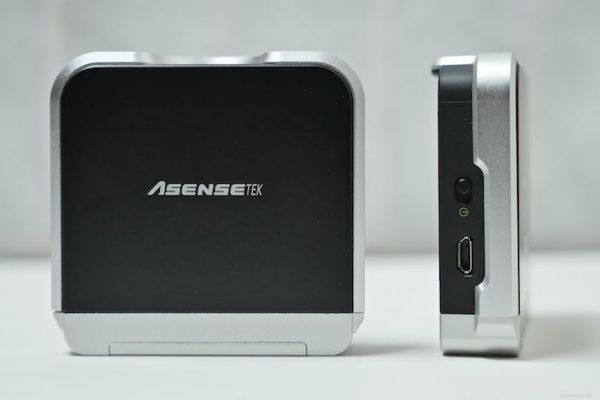
Lighting Passports are small black plastic boxes framed in matte-finished aluminum, measuring 68.5mm x 17mm x 56mm (about 2.7” x .7” x 2.2”) and weighing 77g (2.7 oz). They come with a clip-on stand with a swing-out foot; the stand can be swapped out for other mounting hardware.
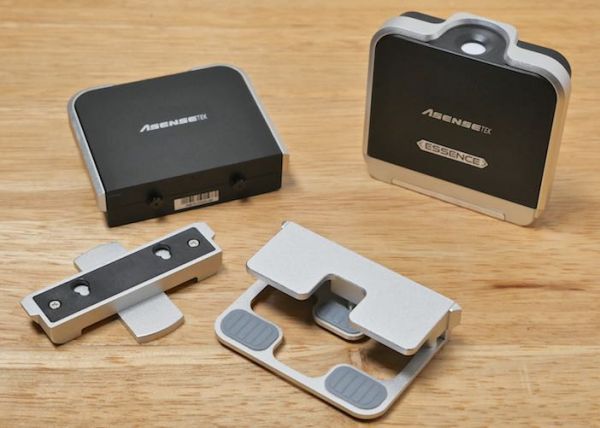
Lighting Passport Standard and Essence with clip-on desk stands and “clipper” device clamp
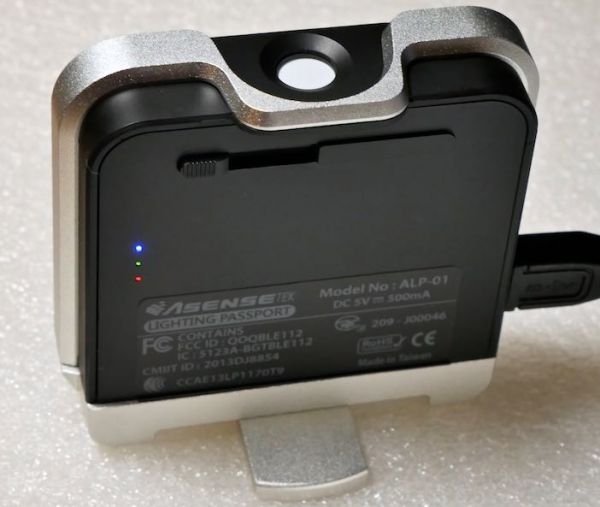
The left side has an on/off switch and a mini-USB port for charging. The back has three LEDs: green for external power, red for charging, and blue for power (though it’s not always a reliable indicator that the spectrometer is turned on). There’s also a slide switch, controlling a shutter over the sensing port on the top of the Passport: a frosted white window through which light enters the device.
The Passport’s internal battery is good for 3–4 hours of continuous power-on time with moderate usage. There’s a battery-level indicator in the controlling app; on my Essence the indicator drops to three out of four segments after about 2 hours 45 minutes, and two out of four after 3:45, but when I checked a few minutes past the four-hour mark the Essence’s battery had pooped out. A full recharge takes about two hours, and the spectrometer can be used on AC while the battery is charging (Asensetek recommends charging it with power off for a while if you’ve run the battery flat).
The Passport comes in a padded rubbery case, about 7.5” x 7.5” x 1.7” (190mm x 190mm x30mm) with an AC adapter and USB power/charging cable. The Standard kit comes with a “clipper” mount for clamping the Passport to an iOS or Android device and a spare screw for the clipper. The Essence kit doesn’t come with a mount.
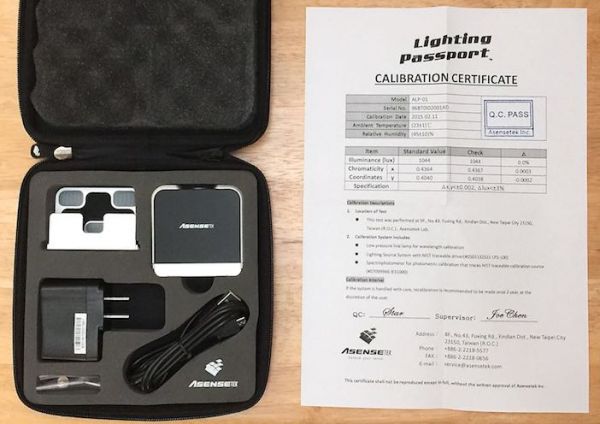
Lighting Passport Standard in its case, with calibration certificate
Both the Essence and Standard models capture the spectrum from 380–780nm, and measure light levels from 5 lux to 50,000 lux. Where they differ is in spectral resolution and accuracy. The Essence measures chromaticity reliably above 100 lux while the Standard works as low as 50 lux; the Essence has 10nm resolution while Standard resolves down to 8nm; and the Standard has about 50% stricter repeatability and accuracy ratings (full specs on the Asensetek website.)
Software
Passports are controlled by free mobile apps: Spectrum Genius Mobile (SGM) for the Standard, and Spectrum Genius Essence (SGE) for the Essence. The apps require iOS 5.1.1 and later or Android 4.4 and later, and Bluetooth Low Energy (BLE) in the mobile device’s hardware. I’ve used the iOS apps on iPod touch 5Gs, an iPhone 5, and an iPhone 6 Plus; the apps work fine on all of them.
SGM is more fully-featured than SGE—more measurements are displayed, and SGM offers a continuous-measurement mode that SGE lacks—but they share the same design and operation. As of May 2016, both SGM and SGE report the following numerical measurements:
- CCT – the Correlated Color Temperature of the light
- CRI(Ra) – the Color Rendering Index. Ra averages the first eight (easy) colors in the CRI test. It’s the most commonly reported ranking for the color quality of a light, but it’s also the least predictive of on-camera color quality
- CQS – Color Quality Scale, a somewhat better metric for rating lights
- Illuminance in both lux and foot candles
- CIE 1931 plot and x,y values
- CIE 1976 plot and u’,v’ values
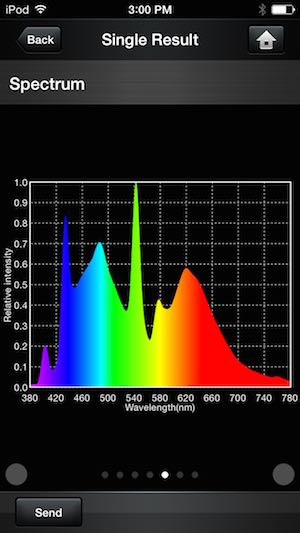
- Spectral power distribution plot
- C78.377-2008 – an ANSI standard for LED lamp chromaticity
- IEC-SDCM – Standard Deviation of Color Matching, or how close is this light to a standard reference (using IEC 60081 standards)?
- λp – peak wavelength: the wavelength of the highest spike in the spectral power distribution.
- TLCI(Qa) – the Television Lighting Consistency Index value for this light.
- GAI – the Gamut Area Index, a measure of the vibrancy of colors when illuminated by this light
SGM adds:
- CRI Re (R1-R15) – a more stringent CRI using all fifteen sample colors, not just the eight easy ones.
- TM-30-15 [pdf]Rf/Rg numbers and plots – an IES-sponsored metric, characterizing both color gamut (Rg) and color rendering fidelity (Rf).
- λD – Dominant wavelength: “the wavelength of the monochromatic stimulus that, when additively mixed in suitable proportions with the specified achromatic stimulus, matches the colour stimulus considered”. [pdf]
- Purity(Pe) – the excitation purity [pdf], a saturation measurement of keen interest to LED manufacturers.
- Duv – distance of the illuminant from the Planckian locus [pdf]; in film/video terms this is tint. Duv is (as far as I can determine) 1/3000 Wratten CC, or 1/100 plusgreen/minusgreen value.
- SP ratio – scotopic / photopic ratio, basically, are you (a human, not a camera) seeing with rods or cones at this light level?
- PPFD (380–780nm) – Photosynthetic Photon Flux Density, or “how efficient is this as a grow light?”
As you can see, these are general-purpose apps, with measurements oriented towards residential and industrial lighting, agriculture, and highway signage as much as television and cine work.
Along with numerical values, both apps generate graphs and plots of various readings:
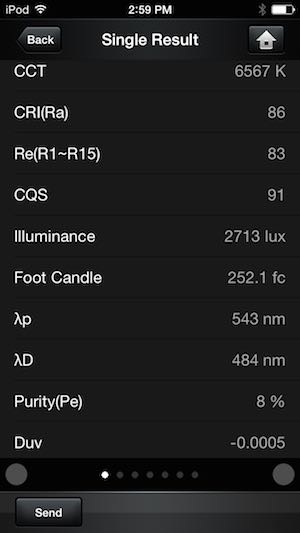
Numerical results…
…and graphical results
All the graphs can be shared via email; here are the plots available:
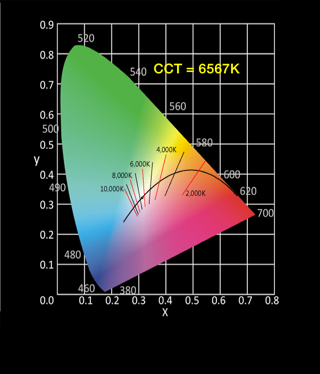
CIE 1931 color space
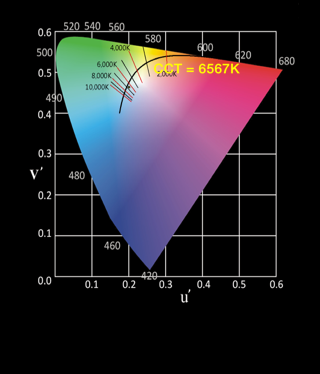
CIE 1976 color space
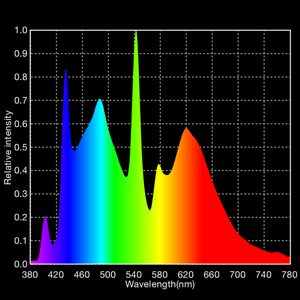
Spectrum (spectral power density) plot
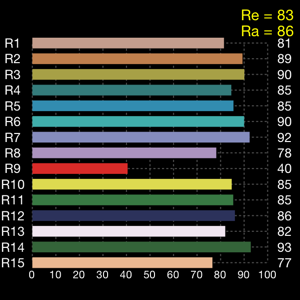
CRI histogram
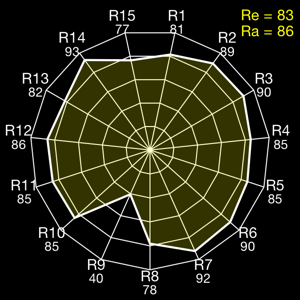
CRI radar (or spider) plot
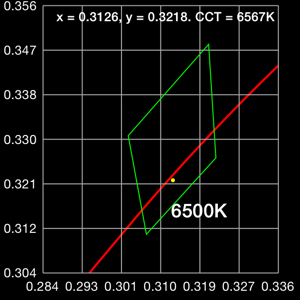
C78.377-2008 ANSI chromaticity plot
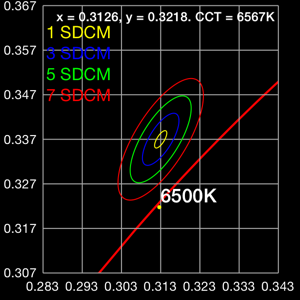
IEC-SDCM color matching plot with MacAdam ellipses
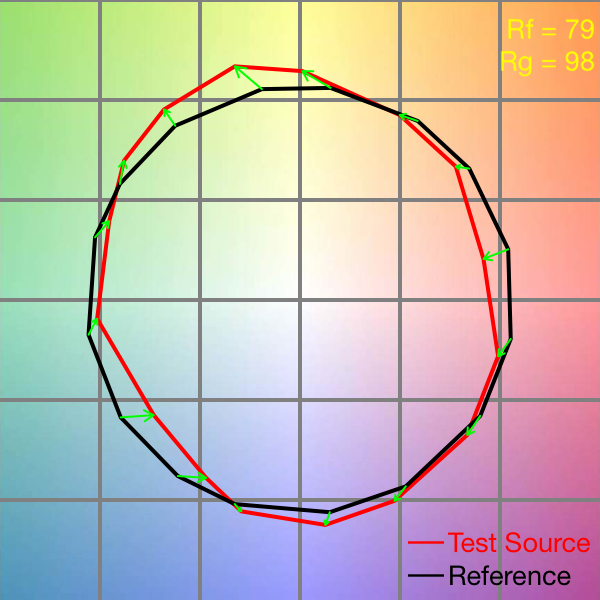
TM-30-15 gamut plot
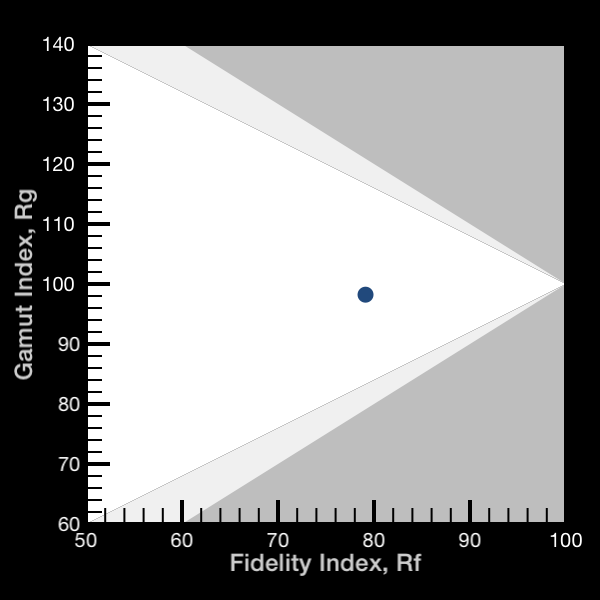
TM-30-15 fidelity plot
Additionally, the sensor’s spectral measurements (interpolated to 1nm resolution) and generated values are stored in a plain-text file for processing by Asensetek’s desktop app, and this data file, along with the graphics, can be emailed to yourself or to others. There’s also a “Smart Pass” data file (available via an in-app upgrade) that a colleague can open in his or her own copy of SGM or SGE without needing to have a Passport attached.
Both apps capture single measurements (snapshots of all those data types) along with time, date, description of the light, GPS coordinates, and even a photo of the lighting instrument or the scene being lit. You can also grab multiple measurements and see max/min/average values. You can take two separate measurements and compare their spectra: you can look at normalized data (both spectra scaled to fill the plot) or non-normalized (spectral energies remain in their original proportions), while a slider lets you compare energy levels at a particular wavelength.
SGM adds a “continuous” mode, letting you capture a preset number of readings at specified intervals, so you can plot how a light’s level and color change as it warms up (I’d love to try this with an HMI, and see exactly how long it takes before brightness and color stabilize).
Note that SGM only works with the Lighting Passport Standard, or with data captured by another instance of SGM; SGE only works with the Lighting Passport Essence or other SGE files.
I don’t have a compatible Android device so I haven’t tested the apps on ‘droids, but the listings on Google Play show the same UI and functionality, and generally high reviews.
There’s more: Asensetek offers the free Spectrum Genius Agricultural for growers, and the $10 Spectrum Genius Transmittance (iOS only) for measuring light and color transmission, for lens and filter testing and characterization.
If you’re rocking an iPad, Spectrum Genius Studio gives you detailed TLCI readings complete with a rendering of X-Rite/Macbeth color-checker patches used in the derivation of the TLCI metric:
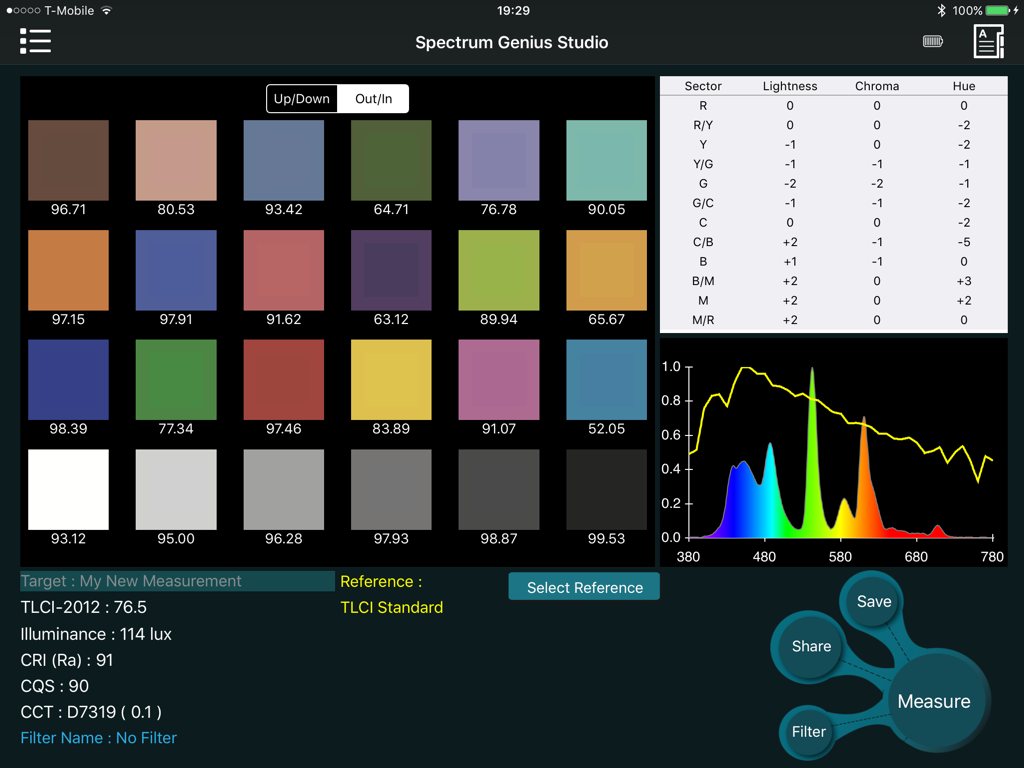
Spectrum Genius Studio on iPad
It’s a dedicated TLCI tool, showing the color rendering under the measured light, the spectrum compared to the reference standard, and the “colorist’s suggestion table” for color-correction tweaks. Studio lets you choose different TLMF (Television Lighting Matching Factor) references: the TLCI standard reference, “standard A” (a 2857K incandescent curve), D50, D55, D60, and D65. It also reports CCT, a coarse tint value in parentheses (+0.3 looks to be a full plusgreen), CRI, CQS, and illuminance in lux.
Spectrum Genius PC is a Windows-based application for analyzing Lighting Passport data. The $200 Standard version comes with the Lighting Passport Standard or is obtainable separately; the $495 Advanced version offers more features. I haven’t used either one; for my purposes the iOS apps provide all the information I need.
Operation
After installing the appropriate app for your flavor of Lighting Passport (SGM works only with the Standard; SGE works only with the Essence; Studio works with either one), launch it, turn on the Passport, and pair it via Bluetooth. Once paired, the app remembers the paired Passport and connects to it automatically… most of the time. When it forgets, it’s easy enough to reconnect.
Select the measurement type (Single or Multiple, or Continuous on SGM), make sure the shutter on the Passport is open, aim the Passport at your light, and press the Measure button.
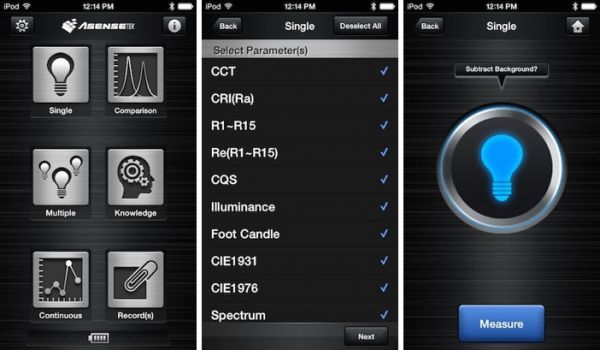
SGM: home screen, single measurement parameter selection, trigger screen
After 2–6 seconds or so, depending on light level, the measurement completes and is displayed in the app. By default, the Passport’s integration time is set automatically, but you can turn off “autoexposure” and dial in a fixed integration time.
If you need to compensate for ambient light, the apps allow “background subtraction”: you take a reading with ambient light only, then with your light to be tested, and the app will subtract the ambient light’s contribution to the reading.
If you’re taking multiple readings, repeat the measurement step, and the app will keep track of the minimum, maximum, and average values.
For continuous testing, you set the interval and the number of readings (it’s the color-metering equivalent of interval recording or time-lapse settings on a camera). Press the Measure button, and SGM will grab measurements over time, plotting them as it goes. You can set intervals from 1ms to 999 minutes, and capture as many reading as you choose.
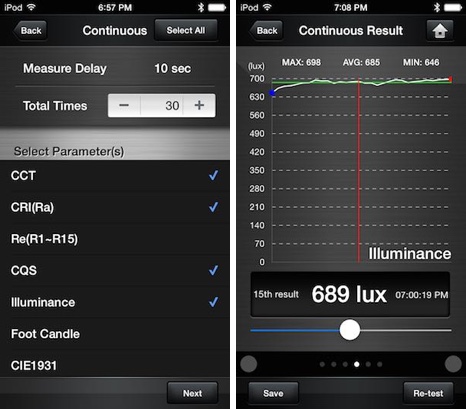
Continuous measurement: setup and results
Unfortunately SGM doesn’t remember these settings; every new continuous measurement defaults to five readings, a minute apart.
Note that the specified delay is the time between the measurements. To get the total time between subsequent readings, you need to add the time taken to command the Passport to take a reading, the time spent in taking the reading itself, and the time spent returning the data to your iDevice and computing the results: the time interval between readings is typically 2–6 seconds longer than Measure Delay alone indicates. As the readings themselves are time-stamped this isn’t a big deal; just don’t expect six readings with a ten-second delay to be completed in exactly one minute.
Sometimes I had multiple identical readings in continuous mode, even though the lighting conditions had definitely changed: for testing, I’d do things like walk the spectrometer towards the light during the test, yet the illuminance would be the same from the second reading onwards. When I had runs with good data, the blue power LED was either off most of the time, with brief pulses on during data transmission, or the LED was on most of the time, pulsing off briefly. Runs with duplicated data had the LED on between some measurements, and off between other measurements; I’m guessing the handshaking between app and spectrometer failed, and instead of reporting an error the app simply replicated data for the missing measurements.
When I walked around with both my iDevice and the spectrometer, I wasn’t able to make it fail, so I’m assuming the failures were due to moving the spectrometer too far from the controlling iDevice for reliable communications.
(About that LED: Normally it’s on, pulsing off only when data is transferred… but not always. Sometimes it’ll be off, pulsing on briefly during data transmission. When I mentioned this, Asensetek agreed that the LED can be inconsistent, but said the LED’s state doesn’t affect functionality, and they plan to fix it in future builds of the product.)
After taking a reading of any type — single, multiple, or continuous — you can save it for later. You can name the measurement, and add information about the light under test. If your device has GPS, the app will save the GPS coordinates. You can take a picture of the light under test with your device’s camera and save it as part of the record.
You can use the Comparison screen to compare the spectra of any two measurements. Swipe right to left to reveal tabular data; swipe again to see CRI histograms.
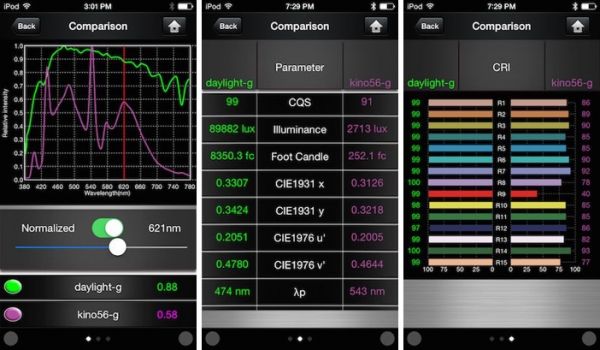
Comparison of daylight to a daylight-lamped Diva Lite 400
Continuous mode aside, the apps worked reliably and well. I had no problems taking readings, viewing and comparing them on my iDevices, and emailing the results to myself or others.
The “clipper” mount supplied with the Standard works, but it’s not ideal. When screwed all the way down, it’s still a bit loose on the slippery iPod touch 5G, but perhaps that’s just as well: the clipper is lined with thin rubber pads to secure it, but there’s not a lot of room for error: when using the clipper on thicker devices I was always in fear of tightening the adjusting screw just ¼ turn too far and crushing my iDevice, or leaving it slightly looser and risk having it fall off (Asensetek tells me I worry too much, and I should tighten it further; for the iPod, the “spare” screw in the kit is slightly longer than the stock screw, specifically to allow firm clamping of thinner devices).
The clipper mount works, but you have to be careful with it
In practical use I just keep the Passport attached to its little stand with the swing-out foot, separate from the iDevice I’m using it with. I’ll pack the Passport in a side pocket of my producer’s bag, or wrap it in a small lens bag and stick it in with other gear; on site I’ll slip it in a pocket when I’m not using it. Its AC adapter is as big as the Passport is, so I’ll usually just pack a USB cable in case I need to charge it, and use my MacBook Pro as a power source.
Essence and Standard Compared
The biggest reported difference between the Essence and Standard, aside from the more limited functionality of the Essence’s companion app, is the spectral resolution: 10nm for the Essence vs. 8nm for the Standard. I was curious to see what difference that made, so I took simultaneous readings under various lights.
I saw two things: one, the Standard’s spectrum plots are generally slightly smoother than the Essence’s, similar to the difference between the plots from the Essence and the C-700, but when there are strong peaks and valleys in the data, the Standard’s peaks are slightly taller and the valleys somewhat deeper than those on the Essence. This makes sense: the Standard’s 20% better color resolution should result in a fuller data set, allowing smoother integration along full spectra as well as stronger discrimination and differentiation with spiky spectra.
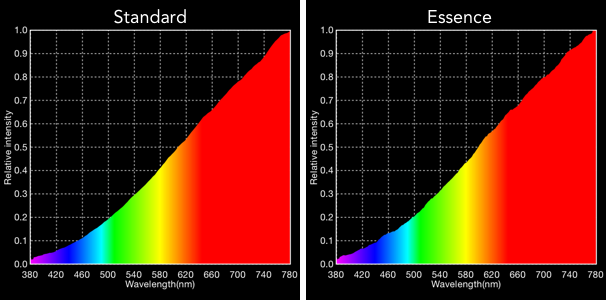
Smooth-spectrum tungsten lighting as shown on the Standard and the Essence
Initially, the Essence’s spectrum plots were consistently 6nm redder than the Standard’s — the peak wavelength measured on the same light was always 6nm different on the two devices. Asensetek told me that over a year ago, after my Essence was built, they changed their calibration procedures and improved their wavelength accuracy; they were not surprised by the difference I saw and suggested I send the Essence in for recalibration. Once I did that, the peak wavelengths matched exactly.
Even so, the Essence’s data aren’t quite as precise as the Standard’s; it doesn’t discriminate between adjacent wavelengths quite as finely. Thus, even though peak wavelengths may match exactly, derived data such as CCT often disagree somewhat. Under a relatively full-spectrum household LED bulb, the Essence reports 2566 K while the Standard shows 2580 K. Under a nasty kitchen fluorescent lamp, Essence says it’s 3143 K while Standard claims it’s 3205 K. Lit by a tungsten PAR, Essence sees 2672 K, Standard sees 2631 K. The readings are different, true, but the differences are so minor as to be negligible; a 40 K change at 2600 K or a 60 K difference at 3200 K simply isn’t visible.
By the same token, the Essence is sometimes more forgiving: its wider frequency bands led to somewhat better numbers for CRI, CQS, and TLCI. While it agrees with the Standard within +/- 1 for CRI, CQS, and TLCI for the nasty kitchen fluoro, the household LED bulb (rated by the manufacturer at CRI 80) measured CRI 82 on the Essence and CRI 79 on the Standard. CQS numbers were 83 and 82, TLCIs were 66.8 and 64.5, with the Essence always showing slightly higher (more lenient) numbers. Even so, the two devices track each other remarkably well.
From a practical TV and cine standpoint, I’m not sure the added discrimination capability of the Standard is a decisive advantage over the Essence; it’s the general shape and spikiness of the curve that’s important, as well as the general values of CCT and the various color-quality metrics. Both will give you the essence (pun intended) of the light; whether its TLCI is 66.8 or 64.5 isn’t as important as the fact that it’s in the 50–60 range instead of 90+.
On the other hand, if you’re using the spectrometer as a defensive tool — wielding its readings as armor against color-blind philistines trying to foist substandard lighting on your production — it can’t hurt to have the higher accuracy to bolster your claims. It’s also worth noting that the Standard’s app provides Duv directly, corresponding to green/magenta tint, while it isn’t shown in the Essence’s app.
Conclusion
Asensetek’s Lighting Passports are some of the more affordable spectrometers available. The Essence model costs about as much as the Sekonic C-700, and when it goes on sale it’s often considerably cheaper. The Standard is rather a bit more expensive, but offers better spectral discrimination and higher accuracy, and its plots are smoother and slightly more detailed.
Lighting Passports are general-purpose tools with readouts for industrial, architectural, and agricultural measurements; they aren’t designed specifically for TV and cine applications. Even so, they offer Correlated Color Temperature and illuminance readings; compute the common quality metrics we use (CRI, CQS, and TLCI); show detailed spectrum plots; and with the Studio app, they can show detailed TLCI data. If you need more color info than a simple tristimulus color meter can provide, the Passports provide it, in a compact package that won’t bulk up your gear bag.
 My only real gripe from the film & video standpoint is the lack of a proper “tint” readout (green/magenta balance). SGM, the app for the Standard, provides Duv, from which you can derive tint, but that’s not a computation most busy DPs and gaffers want to do in their head (quick: what compensation will you need for a Duv value of .0032?). The Essence’s SGE app doesn’t display Duv, though it’s present in the data file.
(iOS 7+ workaround: email yourself a reading. In the received email, tap and hold the .txt file at the bottom until a share sheet pops up, then tap Quick Look. Duv is listed in the file; multiply by 3000 for Wratten CC value or by 100 for plusgreen/minusgreen value. Easy-peasy, eh what? Yeah, I’d rather have a tint readout in the app, thanks all the same.)
Still, Asensetek is interested in making the Passports better film / video tools. CQS readings have been in the software for a while, while TLCI readings were added in the last year. The separate, iPad-only Studio app is a dedicated TLCI tool that works with either the Essence or the Standard, and is focused entirely on our industry.
When I suggested adding a tint readout in SGE and SGM, Asensetek was very interested in the idea, and they now tell me they plan an iPhone-compatible Studio app that includes tint, CCi and LBi filter settings, ISO, EV setting (shutter, F-number, aperture), white balance and mixed-lighting modes. In short, the new Studio app will aim to be a complete incident-reading exposure and color meter. They expect to release it in Q3 2016.
Do you need one? A spectrometer is a very esoteric tool. It provides you with gobs of information about your light, most of which you can’t do much with on-set. CCT, Tint, and illuminance are the things you can fiddle with on a shoot day; fine-tuning gaps in the spectrum, not so much.
I’d argue that a spectrometer is more useful as an evaluation and planning tool than as a setting-lights-up tool. When you’re building a studio, testing lighting instruments for purchase or rental, scouting practical locations with impractical lighting, or just trying to better understand why the light from an instrument renders colors the way it does, a spectrometer reveals details beyond basic color temperature and tint metrics.
Getting CRI, CQS, and TLCI readings requires a spectrometer. While even TLCI is only prescriptive if you’re shooting Macbeth charts with prism cameras, it’s still part of your predictive arsenal (along with CRI and CQS) in trying to figure out how likely it is that a particular light or set of lights will get you into trouble.
In short, the added value of a spectrometer is not in solving on-set problems so much as in discovering problems and heading them off before they occur. Whether this is something you’re willing to pay $1000–$2000 for, only you can say.
But if you do decide that a spectrometer is a worthwhile investment, Lighting Passports are worth a look.
Pros
- Full spectral plots from 380nm to 780nm, plus CRI bar and spider charts
- CCT, CRI, CQS and TLCI readings
- Illuminance in lux and foot candles
- UI runs on your iOS or Android device, so you can control the sensor remotely
- iOS and Android make it easy to share lighting data (including charts and plots) via email
- Small and lightweight sensor (smallest / lightest spectrometers available)
- Separate Studio app (iPad only) for full TLCI chart computation and display
- Ability to share data with other instances of the mobile apps, or a PC-based analysis program
- Lighting Passport Essence is often the most affordable spectrometer available
Cons
- No tint readings (though tint can be computed from Duv data in the text file)
- Continuous-mode readings subject to unreported failure, with repeated readings in the resulting data, if you get too much separation between the spectrometer and your iDevice or Android
Cautions
- Passports require an iOS 5.1.1+ or Android 4.4+ device with Bluetooth Low Energy; if you don’t already have one, that’s an added cost
- Asensetek says that Lighting Passports should be recalibrated every year or two, and they have to be shipped to Taiwan for calibration
- I can’t speak as to the absolute accuracy of the Lighting Passports’ measurements or computed results, because I don’t have a better reference to compare them to. All I can say is that they give me results that track results I’ve gotten from other color meters, and display spectra looking very much like the spectra displayed by a Sekonic C-700 measuring the same lighting instruments.
Disclosure: I bought the Lighting Passport Essence with my own funds; Asensetek gave me the Standard to test after I discussed color metering for film & video with them (they did not say I needed to write a review of it and, when I offered to return it to them after testing, they said they did not want it back). I briefly had a Sekonic C-700 spectrometer on loan, since returned. There is no material connection between me and Asensetek or Sekonic, and no one has offered any compensation or other blandishments for a favorable review.
I do sell a “competing” iOS app, Cine Meter II, if you consider an app with a tristimulus color meter function to be in competition with a full-spectrum spectrometer.