
 Sony gives us a lot of gamma table options in the F5 and F55. I recently had a chance to sit down with an F5 and map them all out, and in doing so I learned a lot about both gamma curves and how BlackMagic Resolve Lite handles them.
I had no idea what I was getting into when I shot these tests. Usually I bring clips into Final Cut Pro, export them to Apple Color and capture waveform images from there, but according to Sony there are no current options to import XAVC HD directly into Final Cut Pro 7 or X. I’m not that familiar with BlackMagic DaVinci Resolve Lite, but I learned a lot… while putting a nice dent in both my forehead and the wall over my desk along the way.
This is the DSC Labs Xyla chart (below). It is the fastest way, by far, to assess how a camera’s various gamma curves will affect an image. Put both it and the camera in a dark room, frame it up, turn out the lights, and then clip the first step while watching a waveform monitor. (The clipping point of the sensor is the only solid reference we have when judging a camera’s dynamic range.)
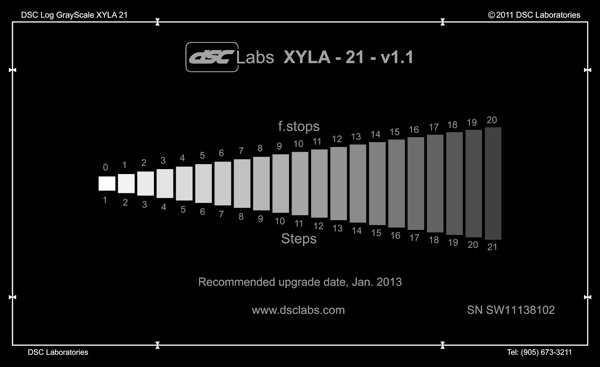
Each step is one f/stop. Not only can we count the total number of stops below clip until the signal dissolves into noise, which tells us about the sensor’s total dynamic range when using that curve, but we can see how that range is distributed in stops above and below 18% gray.
Normally, this is a simple process. In this case there was an additional learning curve.
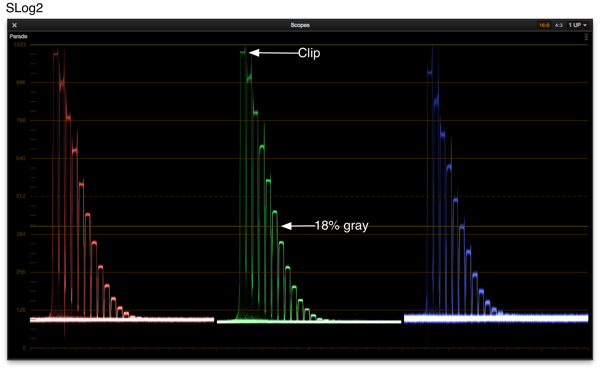
This is what the Xyla chart look like when shot in Slog2 to XAVC HD and brought into Resolve Lite. I tried using the luminance-only waveform but it’s actually some form of RGB overlay and wasn’t really clear enough to see exactly when luminance clipped. Instead I switched the waveform to Parade RGB mode and used the green channel as my clipping reference, as the greatest portion of the overall picture luminance in video is derived from the green channel. What you see above is a single frame where the top step on the Xyla chart is just barely clipped. (I push the exposure up until the highest step in the green channel just barely flattens out.)
18% gray wasn’t as easy to find. The Resolve waveform is marked in code values, not IRE values, and their tech support people don’t know what code value represents 18% gray in Rec 709 video. Fortunately I shot a DSC Labs Chroma Du Monde chart with an 18% gray background at the same time that I shot the Xyla, and I exposed the background at 40 IRE:
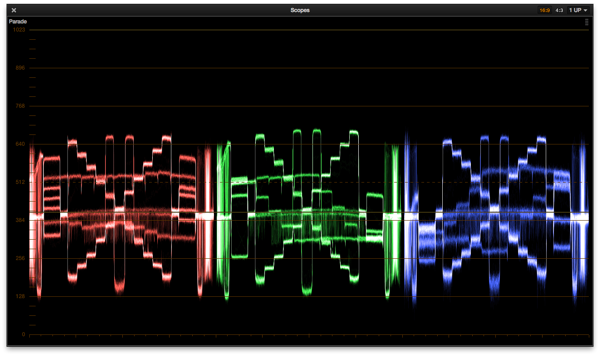
By looking at the crossover point (the center of the “X”) and knowing that I exposed it at 40 IRE (18% gray in Rec 709 is technically 41.7 IRE) I had a pretty good idea of where 18% gray fell in code values. A little research on the Internet showed that Sony placed their middle gray value for SLog1 at code value 394, so the value above–marked with a yellow line at 412–seems to pretty close to where it should be.
Log values for 18% gray are often arbitrary as log curves are storage formats only and are always meant to be graded. Companies cheat middle gray up or down depending on how quiet the camera is and how much overexposure latitude they can squeak out of the sensor. For example, Canon’s Canon Log places middle gray around 32 IRE, which gives them roughly an additional f/stop of overexposure latitude above middle gray, but when that material is graded 18% gray will most likely be pushed up to 40 IRE while the highlights are pulled down a little. The C300 and C500 are quiet enough that a one stop “push” to middle gray is no big deal.
The one bit of math I learned–and retained!–in high school is the ability to calculate ratios. This formula has been extraordinarily useful over the years, so I will share it with you now:
A is to B as C is to D
or
A/B = C/D
The exact IRE value for 18% gray in Rec 709 video is 41.7. (I normally round off to 40 IRE when exposing on set.) What I wanted to find is the code value fell at the same place in 0-1023 range as 41.7 IRE does in the 0-109 IRE range, just to see if that might be valid place to put 18% gray. To do that I plugged the numbers into the formula:
41.7 is to 109 as x is to 1024
or
41.7/109 = x/1024
To find x multiply the two values that are diagonal to each other and divide by the remaining value:
(41.7 * 1024) / 109 = 391.75
Huh. When I placed the yellow reference line in Resolve on the Chroma Du Monde’s crossover point the value came out to 412. Maybe I’m missing something.
I know that the actual data values under the hood place black at 64 and white at 940 in video, so maybe I need to account for that. The difference of the two is 876, so:
41.7 * 876 / 109 = 335.13
Add an offset of 64 to that to account for where black sits and we get 399.13. Close, but not perfect.
Let’s go the other way. How far off am I with a value of 412 as middle gray in a range of 0-1023?
412/1024 = x/109
or
412 * 109 / 1024 = 43.85 IRE
I think I can live with a difference of maybe two IRE units. I know I exposed the chart at 40 IRE, so at least I know where 18% gray is. I can see where the clipping point is, and I can also see where the noise floor is, so regardless of the code values/IRE units I can simply count stops and know what I’m getting without having to know the actual code/IRE values of what’s happening at either end of the scale. I know that clip will end up as white and the noise floor will be black, and anything in between is my usable range.
Okay, on to actual curves. Here’s SLog2 again:

If I count down from the clipping point I see 1, 2, 3, 4, 5 steps before 18% gray falls almost exactly between step 5 and 6. That tells me that in SLog2 mode I have 5.5 stops from 18% gray until I hit white clip. (This is at ISO 2000, and indeed all these tests were shot at ISO 2000. I did look at different ISOs to see if the distribution of stops changed from ISO to ISO, and they didn’t.)
Counting down from 18% gray, I see nine steps pretty clearly. Add the half stop between steps 5 and 6 for a total of 9.5 stops between middle gray and the noise floor. That’s possible, but it’s a good idea to look at the other color channels and see what’s going on. It’s a good idea to notice that blue’s noise floor–its “base”–is much thicker than green or red’s. That’s noise. The closer your white balance is to 3200K the thicker that line becomes as there’s very little blue in tungsten light and silicon sensors are notoriously insensitive to blue. Under tungsten light it’s safe to assume those last few stops will show a bit of noise in the blue channel. In daylight you’ll see a much cleaner blue channel but maybe half as much noise in the red channel.
UPDATE: It’s been pointed out to me that Sony places middle gray in SLog2 32% (code value 347) instead of 38% as in SLog1. That seems to be confirmed here. As best I can tell this adds an additional 1/2 stop to SLog2’s dynamic range, for a total of six stops of overexposure headroom. Where 18% gray is placed in log is a little arbitrary, as you’ll always restore that in the grade if necessary. Log is only a storage format so it is exempt from many of the “rules” of Rec 709.
Note that the first six or so steps are evenly spaced but their spacing changes toward the bottom of the curve. The log curve works hard to give every stop exactly the same amount of space but the sensor response rolls off naturally as it approaches the noise floor. The closer the steps are the less contrast there is between them and the harder they are to see, so the last two or three steps are “nice to haves” but aren’t guaranteed, especially if you decide to crush the blacks a little bit in the grade.
Let’s move on to the Hypergamma curves. In the F900 days Sony used to say that Hypergammas were meant as a compromise between log and WYSIWYG: they gave you a nice picture to look at during the shoot while also giving you enough information to do a nice grade. This is still true, but the reality is that if you’re going to do a real grade you’ll probably shoot in SLog2, and most projects shot with a Hypergamma curve will never be graded. That’s certainly how I use them with my clients: Hypergammas are useful when I shoot WYSIWYG because they capture the most dynamic range possible in a WYSIWYG image that really doesn’t need further grading.
First, a few notes about terminology:
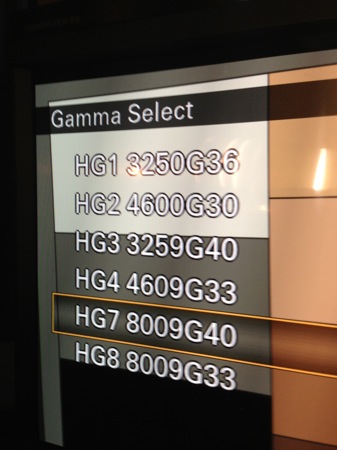
Sony has done something really neat here. In the past you had to look in the manual to see which Hypergammas did what, and even then you only had a vague idea of what was going on. You really had to look at them live and make notes to remember what each was doing. There’s no need for that anymore as Sony has put enough information up front to tell you exactly what’s going on.
Here’s what it means:
“HG#” is the name of the curve.
The set of three numbers after HG (325, 460, 800) tells you the maximum reflectance value before clip. For a long time I thought of this as a bit cryptic, but it’s really not.
We know what 18% reflectance is (middle gray) so it should be fairly simple to figure out how bright 800% reflectance is. To make things easier I’m going to round up to 25% reflectance, which is almost a half stop brighter than 18% gray.
25% reflectance = + ~.5 stops from 18% gray
50% reflectance = + ~1.5 stops from 18% gray
100% reflectance = + ~2.5 stops from 18% gray
200% reflectance = + ~3.5 stops from 18% gray
400% reflectance = + ~ 4.5 stops from 18% gray
800% reflectance = + ~5.5 stops from 18% gray
You can very quickly see how much overexposure latitude a gamma curve will give you by looking at those three numbers.
Anything beyond about 90% reflectance, by the way, is a specular reflection off a shiny surface or a bit of stray sunlight striking something in an otherwise normally-exposed shot. 90% reflectance is about the brightest you can make an object if you’re shooting it “at stop,” meaning you took an incident reading of the light hitting that object and put that stop on the lens. Anything brighter than that is additional light from somewhere else or a specular highlight.
The next number, “0” or “9”, tells you whether the curve clips brightness values at the broadcast legal limit (100 IRE) or gives you full range (109 IRE). Full range is usually better as you can capture at least a stop more of highlight information and retain enough contrast to see it, but if you’re shooting for broadcast and no one will ever touch this footage again then selecting a “0” Hypergamma will make your footage broadcast safe as you shoot it. What you see is really what will go out over the air.
“G” tells you where middle gray falls, but not really. This is a little confusing, so stay with me:
“G40” means 18% gray is plotted where it should be, at 40 IRE. (Technically 41.7, but that’s for those of us who wear propellors on our heads.)
“G36” means that instead of plotting 18% gray at 40 IRE, as in the previous curve, Sony has pulled it down maybe 1/3-1/2 stop to 36 IRE. This doesn’t mean that you should expose middle gray any differently; all it’s saying is that Sony has moved 1/3-1/2 stop of dynamic range from the highlights to the shadows, which stretches out the highlights a little and gives them more contrast. If you have a shot with a lot of highlights and not much in the way of shadows a “G36” curve will crush the shadows a little and open up contrast in the highlights.
A “G33” curve will crush the shadows a bit more and open up the highlights a bit more.
So, to recap: the name of each curve tells you how much highlight latitude it has, whether or not it will clip brightness levels at 100IRE to make your footage broadcast safe, and whether it’s given you “normal” highlights and shadows or whether it’s stretching out the highlights and crushing the shadows a bit to show more highlight detail.
There are other curves in the camera but I’ve opted not to write about them here, partially because I never use them as highlight adjustments require use of a knee circuit–which I hate–but also because this article is too damned long as it is.
Let’s start from the top and work our way down:
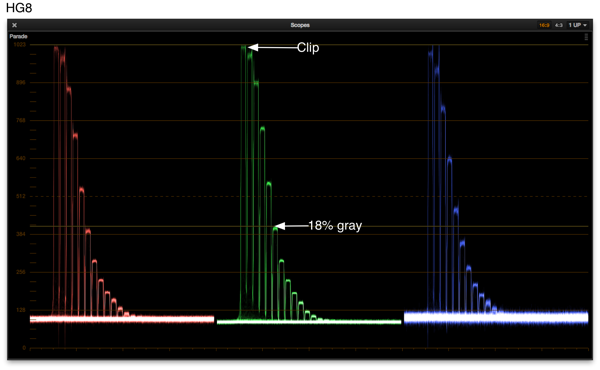
Hypergamma 8 gives us +5/-9 from 18% gray. Those last couple of stops on the low end are gravy stops, and I define those thusly:
Gravy stops: If there’s detail present, that’s gravy. One way or the other the presence of detail or lack of detail in these tones won’t affect your employment status.
Paycheck stops: Detail must be present in those tones or your paycheck stops.
Technically, while there are about 9 stops of latitude between 18% gray and the noise floor, I’d only count on 7 actual “paycheck” stops.
This is a “G33” curve so it’s crushing the shadows just a little while stretching contrast in the highlights to resolve more highlight detail.
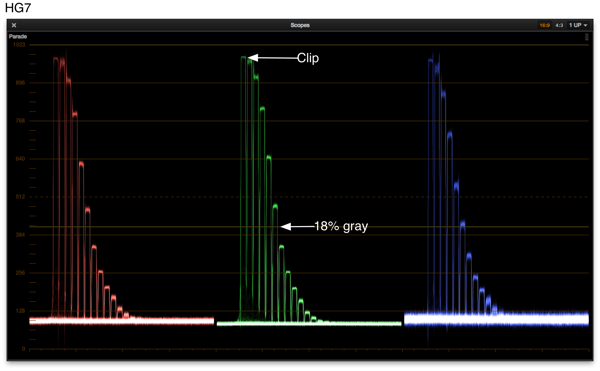
This is Hypergamma 7, which will probably be my “go to” Hypergamma. We now have +5.5/-8 stops, although stop -9 is way down there. I’d count on +5.5/-7.
There’s still a fair bit of detail between clip and the stop just below it, at +4.5 above 18% gray, but not a ton. This is a “G40” curve, and if you look at the “G33” curve above you’ll see a little more separation between clip and stop +4.5.
Sony speaks of these curves as “Rec 709 800” curves, meaning they are meant to be viewed in Rec 709 and they capture 800% reflectance highlights. They also talk about SLog2 as being “Rec 709 1300” because they claim to capture 1300% reflectance, or an additional 1/2 stop or so of highlight detail for six stops total overexposure headroom, although I’m really only seeing +5.5 stops in XAVC. That extra half stop may be available in raw.
When I asked why they didn’t create an HG9 1300% Hypergamma curve I was told by a Sony engineer that there’s no point, and this makes sense to me. I’ve discovered that the most important stops in Rec 709 are the four that fall between 20 IRE and 80 IRE, because those have the same spacing that you’d see if the dynamic range of your scene was only six stops total–which is all Rec 709 was originally designed to hold. We see mid-tones most clearly while rolling off highlights and shadows, so by spacing out those middle four stops and making them really contrasty nearly any image will look great. The rest of the information can be gradually compressed into the last 20 IRE at the top or bottom of the curve and we’re perfectly happy as that’s how humans see highlights and shadows anyway.
The point this engineer was trying to make is that trying to cram any extra highlight information beyond 5.5 stops into that 20 IRE highlight range was pointless as it’d be so compressed you most likely wouldn’t be able to see it.
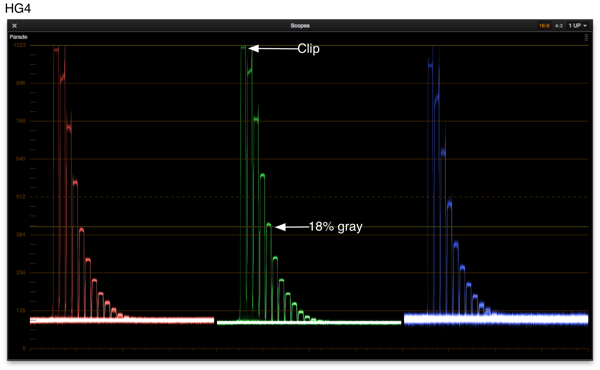
HG4 is a 109% “G33” curve, so the highlights have been stretched by pushing what would have been middle gray in the previous curve down by nearly a stop. I see +4/-8 here, although the last two stops above the noise floor are gravy. This is a great curve to use if you’re shooting in a low contrast environment and you don’t want the tones above 18% gray to look too milky. If scene highlights aren’t very bright and you put them into a curve that’s designed to hold a lot of highlight detail then none of them will appear very bright because they won’t approach the top of the curve. This more contrasty curve will give some “snap” to low contrast highlights while also reducing noise by pushing the bottom few stops closer to the noise floor.
Indeed, if you look at the thickness of the noise floor in the blue channel you’ll see it’s just slightly thinner in HG4 than it is in HG7.
Here’s the big gotcha in the F5, though: When you change between certain Hypergammas your ISO will change as well. For example, if you shoot a shot in HG7 at ISO 2000 and then switch to HG4, which handles only 460% reflectance, the ISO will change automatically to ISO 1000. This is because the camera is maintaining the clipping point but not maintaining 18% gray. Transitioning from a white clip point of 800% to 460% results in a highlight dynamic range reduction of about one stop, which is the difference between ISO 2000 and ISO 1000.
The short version: if you change from a Hypergamma to another that has a different maximum reflectivity number, your ISO will change automatically.
What this means to you is that if there’s something in the background that is just clipping in HG7 (800%) and you change the gamma curve to HG4 (460%), the ISO will change by one stop and the mid-tones and shadows will look a stop darker but the highlight will still clip exactly the same way.
I don’t have HG3 to show you due to a corrupted file but it’s a 325% “G40” curve, so it will open up contrast in the highlights a little more while also opening up the shadows a little bit by pulling them up a half stop. It’s a slightly more contrasty version of HG4.

HG2 is basically HG4 but capped at 100 IRE for broadcast. I see +4 1/3/-8 2/3 here, although the usual disclaimer applies to those bottom couple of stops.
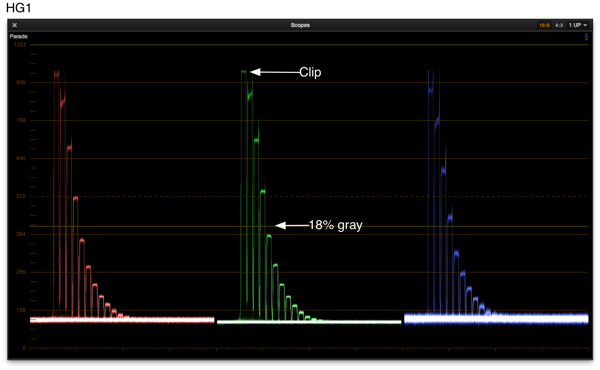
And, last but not least, HG1 is basically HG3 but capped at 100 IRE for broadcast. I see a reliable +3.75/~-8.25 here.
To sum up Hypergamma notation:
Any gamma curve where “G” is less than 40 is crushing the shadows a little and opening up the highlights.
The higher the percentage (325, 460, 800) the more overexposure latitude you should have.
If you need to protect for broadcast then select one of the curves that says “0” just before the “G” that indicates highlights are capped at 100%.
Last but not least, if you use the waveform monitor in Resolve pay close attention to how you set up your clips in the media or conform rooms. Right-clicking on a clip shows you that clip’s attributes, including whether the waveform shows exposure data as data levels (0-1023), video levels (64-940), or “auto, ” which just stretches out the video levels to cover the full height of the waveform. If you’re matching brightness across clips make sure they are all set the same so that your grading is visually consistent between all clips: select all the clips, right click, and then select one of those three options.
One last little tidbit: you may have noticed that the upper steps in the waveforms above have “ears”: little vertical lines that extend beyond the top of the brighter steps. That’s the detail circuit in the camera adding extra sharpening to the highlights, which is generally a bad thing and has since been eliminated by camera firmware updates. (I shot these tests with the original F5 firmware, 1.0.) I just wanted to point this out as this is a great way to detect how active a camera’s detail circuit is. If you find a level you like, look at a chip chart and note how big the ears are–and then you can match that level of detail in another, perhaps completely different, camera.
I have worked as a paid consultant to DSC Labs.
Art Adams | Director of Photography | 03/08/2013 | www.artadamsdp.com